


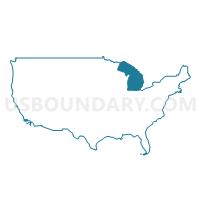
State Senate District 34, Michigan
About
Outline

Summary
| Unique Area Identifier | 200597 |
| Name | State Senate District 34 |
| State | Michigan |
| Area (square miles) | 4,870.10 |
| Land Area (square miles) | 2,319.59 |
| Water Area (square miles) | 2,550.51 |
| % of Land Area | 47.63 |
| % of Water Area | 52.37 |
| Latitude of the Internal Point | 43.61381940 |
| Longtitude of the Internal Point | -86.42281800 |
| Total Population | 275,923 |
| Total Housing Units | 131,873 |
| Total Households | 106,136 |
| Median Age | 39.7 |
Maps

Graphs
Select a template below for downloading or customizing gragh for State Senate District 34, Michigan


Neighbors
Neighoring State Legislative District Upper Chamber (by Name) Neighboring State Legislative District Upper Chamber on the Map
- State Senate District 1, WI
- State Senate District 20, WI
- State Senate District 28, MI
- State Senate District 30, MI
- State Senate District 33, MI
- State Senate District 35, MI
- State Senate District 8, WI
Top 10 Neighboring County (by Population) Neighboring County on the Map
- Milwaukee County, WI (947,735)
- Kent County, MI (602,622)
- Ottawa County, MI (263,801)
- Muskegon County, MI (172,188)
- Sheboygan County, WI (115,507)
- Ozaukee County, WI (86,395)
- Manitowoc County, WI (81,442)
- Montcalm County, MI (63,342)
- Newaygo County, MI (48,460)
- Mecosta County, MI (42,798)
Top 10 Neighboring County Subdivision (by Population) Neighboring County Subdivision on the Map
- Muskegon city, Muskegon County, MI (38,401)
- Norton Shores city, Muskegon County, MI (23,994)
- Muskegon charter township, Muskegon County, MI (17,840)
- Spring Lake township, Ottawa County, MI (14,300)
- Fruitport charter township, Muskegon County, MI (13,598)
- Muskegon Heights city, Muskegon County, MI (10,856)
- Egelston township, Muskegon County, MI (9,909)
- Dalton township, Muskegon County, MI (9,300)
- Sparta township, Kent County, MI (9,110)
- Ludington city, Mason County, MI (8,076)
Top 10 Neighboring Place (by Population) Neighboring Place on the Map
- Muskegon city, MI (38,401)
- Norton Shores city, MI (23,994)
- Muskegon Heights city, MI (10,856)
- Ludington city, MI (8,076)
- Wolf Lake CDP, MI (4,104)
- Fremont city, MI (4,081)
- Roosevelt Park city, MI (3,831)
- North Muskegon city, MI (3,786)
- Whitehall city, MI (2,706)
- Montague city, MI (2,361)
Top 10 Neighboring Elementary School District (by Population) Neighboring Elementary School District on the Map
Top 10 Neighboring Unified School District (by Population) Neighboring Unified School District on the Map
- Grand Haven Area Public Schools, MI (39,731)
- Muskegon City School District, MI (36,988)
- Mona Shores Public School District, MI (23,104)
- Reeths-Puffer Schools, MI (21,505)
- Cedar Springs Public Schools, MI (19,294)
- Big Rapids Public Schools, MI (18,956)
- Fruitport Community Schools, MI (17,961)
- Orchard View Schools, MI (16,917)
- Ludington Area School District, MI (15,954)
- Sparta Area Schools, MI (14,313)
Top 10 Neighboring State Legislative District Lower Chamber (by Population) Neighboring State Legislative District Lower Chamber on the Map
- State House District 73, MI (105,447)
- State House District 102, MI (99,061)
- State House District 74, MI (97,079)
- State House District 89, MI (96,358)
- State House District 101, MI (92,671)
- State House District 91, MI (90,216)
- State House District 70, MI (89,992)
- State House District 100, MI (86,569)
- State House District 92, MI (83,989)
- Assembly District 2, WI (61,009)
Top 10 Neighboring 111th Congressional District (by Population) Neighboring 111th Congressional District on the Map
- Congressional District 2, MI (698,831)
- Congressional District 3, MI (694,695)
- Congressional District 4, MI (686,378)
Top 10 Neighboring Census Tract (by Population) Neighboring Census Tract on the Map
- Census Tract 9705, Montcalm County, MI (7,705)
- Census Tract 27, Muskegon County, MI (7,653)
- Census Tract 25, Muskegon County, MI (7,577)
- Census Tract 103, Oceana County, MI (7,045)
- Census Tract 36, Muskegon County, MI (6,578)
- Census Tract 9607, Mecosta County, MI (6,454)
- Census Tract 28, Muskegon County, MI (5,945)
- Census Tract 106, Oceana County, MI (5,703)
- Census Tract 23, Muskegon County, MI (5,699)
- Census Tract 37, Muskegon County, MI (5,487)
Top 10 Neighboring 5-Digit ZIP Code Tabulation Area (by Population) Neighboring 5-Digit ZIP Code Tabulation Area on the Map
- 49442, MI (41,214)
- 49441, MI (36,308)
- 49444, MI (29,456)
- 49445, MI (20,784)
- 49307, MI (20,112)
- 49456, MI (18,581)
- 49431, MI (16,875)
- 49319, MI (16,181)
- 49660, MI (14,066)
- 49337, MI (12,088)
Data
Demographic, Population, Households, and Housing Units
** Data sources from census 2010 **
Show Data on Map
Download Full List as CSV
Download Quick Sheet as CSV
| Subject | This Area | Michigan | National |
|---|---|---|---|
| POPULATION | |||
| Total Population Map | 275,923 | 9,883,640 | 308,745,538 |
| POPULATION, HISPANIC OR LATINO ORIGIN | |||
| Not Hispanic or Latino Map | 260,220 | 9,447,282 | 258,267,944 |
| Hispanic or Latino Map | 15,703 | 436,358 | 50,477,594 |
| POPULATION, RACE | |||
| White alone Map | 234,481 | 7,803,120 | 223,553,265 |
| Black or African American alone Map | 25,668 | 1,400,362 | 38,929,319 |
| American Indian and Alaska Native alone Map | 2,353 | 62,007 | 2,932,248 |
| Asian alone Map | 1,321 | 238,199 | 14,674,252 |
| Native Hawaiian and Other Pacific Islander alone Map | 43 | 2,604 | 540,013 |
| Some Other Race alone Map | 5,262 | 147,029 | 19,107,368 |
| Two or More Races Map | 6,795 | 230,319 | 9,009,073 |
| POPULATION, SEX | |||
| Male Map | 137,353 | 4,848,114 | 151,781,326 |
| Female Map | 138,570 | 5,035,526 | 156,964,212 |
| POPULATION, AGE (18 YEARS) | |||
| 18 years and over Map | 208,193 | 7,539,572 | 234,564,071 |
| Under 18 years | 67,730 | 2,344,068 | 74,181,467 |
| POPULATION, AGE | |||
| Under 5 years | 17,746 | 596,286 | 20,201,362 |
| 5 to 9 years | 18,313 | 637,784 | 20,348,657 |
| 10 to 14 years | 19,041 | 675,216 | 20,677,194 |
| 15 to 17 years | 12,630 | 434,782 | 12,954,254 |
| 18 and 19 years | 7,596 | 304,817 | 9,086,089 |
| 20 years | 3,486 | 149,350 | 4,519,129 |
| 21 years | 3,127 | 138,484 | 4,354,294 |
| 22 to 24 years | 9,355 | 381,238 | 12,712,576 |
| 25 to 29 years | 15,999 | 589,583 | 21,101,849 |
| 30 to 34 years | 15,758 | 574,566 | 19,962,099 |
| 35 to 39 years | 15,931 | 612,493 | 20,179,642 |
| 40 to 44 years | 17,498 | 665,481 | 20,890,964 |
| 45 to 49 years | 20,926 | 744,581 | 22,708,591 |
| 50 to 54 years | 21,413 | 765,452 | 22,298,125 |
| 55 to 59 years | 19,694 | 683,186 | 19,664,805 |
| 60 and 61 years | 7,000 | 243,067 | 7,113,727 |
| 62 to 64 years | 9,496 | 325,744 | 9,704,197 |
| 65 and 66 years | 5,242 | 177,313 | 5,319,902 |
| 67 to 69 years | 7,363 | 241,312 | 7,115,361 |
| 70 to 74 years | 9,705 | 306,084 | 9,278,166 |
| 75 to 79 years | 7,333 | 244,085 | 7,317,795 |
| 80 to 84 years | 5,829 | 200,855 | 5,743,327 |
| 85 years and over | 5,442 | 191,881 | 5,493,433 |
| MEDIAN AGE BY SEX | |||
| Both sexes Map | 39.70 | 38.90 | 37.20 |
| Male Map | 38.70 | 37.60 | 35.80 |
| Female Map | 40.80 | 40.00 | 38.50 |
| HOUSEHOLDS | |||
| Total Households Map | 106,136 | 3,872,508 | 116,716,292 |
| HOUSEHOLDS, HOUSEHOLD TYPE | |||
| Family households: Map | 73,062 | 2,554,073 | 77,538,296 |
| Husband-wife family Map | 53,497 | 1,857,127 | 56,510,377 |
| Other family: Map | 19,565 | 696,946 | 21,027,919 |
| Male householder, no wife present Map | 5,491 | 185,363 | 5,777,570 |
| Female householder, no husband present Map | 14,074 | 511,583 | 15,250,349 |
| Nonfamily households: Map | 33,074 | 1,318,435 | 39,177,996 |
| Householder living alone Map | 27,459 | 1,079,678 | 31,204,909 |
| Householder not living alone Map | 5,615 | 238,757 | 7,973,087 |
| HOUSEHOLDS, HISPANIC OR LATINO ORIGIN OF HOUSEHOLDER | |||
| Not Hispanic or Latino householder: Map | 102,493 | 3,757,825 | 103,254,926 |
| Hispanic or Latino householder: Map | 3,643 | 114,683 | 13,461,366 |
| HOUSEHOLDS, RACE OF HOUSEHOLDER | |||
| Householder who is White alone | 93,685 | 3,158,462 | 89,754,352 |
| Householder who is Black or African American alone | 8,610 | 523,980 | 14,129,983 |
| Householder who is American Indian and Alaska Native alone | 844 | 22,676 | 939,707 |
| Householder who is Asian alone | 333 | 74,263 | 4,632,164 |
| Householder who is Native Hawaiian and Other Pacific Islander alone | 12 | 860 | 143,932 |
| Householder who is Some Other Race alone | 1,303 | 39,917 | 4,916,427 |
| Householder who is Two or More Races | 1,349 | 52,350 | 2,199,727 |
| HOUSEHOLDS, HOUSEHOLD TYPE BY HOUSEHOLD SIZE | |||
| Family households: Map | 73,062 | 2,554,073 | 77,538,296 |
| 2-person household Map | 33,362 | 1,116,122 | 31,882,616 |
| 3-person household Map | 15,611 | 575,906 | 17,765,829 |
| 4-person household Map | 13,272 | 490,745 | 15,214,075 |
| 5-person household Map | 6,478 | 230,373 | 7,411,997 |
| 6-person household Map | 2,667 | 87,344 | 3,026,278 |
| 7-or-more-person household Map | 1,672 | 53,583 | 2,237,501 |
| Nonfamily households: Map | 33,074 | 1,318,435 | 39,177,996 |
| 1-person household Map | 27,459 | 1,079,678 | 31,204,909 |
| 2-person household Map | 4,664 | 191,327 | 6,360,012 |
| 3-person household Map | 604 | 27,576 | 992,156 |
| 4-person household Map | 215 | 13,570 | 411,171 |
| 5-person household Map | 85 | 3,701 | 126,634 |
| 6-person household Map | 35 | 1,628 | 48,421 |
| 7-or-more-person household Map | 12 | 955 | 34,693 |
| HOUSING UNITS | |||
| Total Housing Units Map | 131,873 | 4,532,233 | 131,704,730 |
| HOUSING UNITS, OCCUPANCY STATUS | |||
| Occupied Map | 106,136 | 3,872,508 | 116,716,292 |
| Vacant Map | 25,737 | 659,725 | 14,988,438 |
| HOUSING UNITS, OCCUPIED, TENURE | |||
| Owned with a mortgage or a loan Map | 52,625 | 1,920,245 | 52,979,430 |
| Owned free and clear Map | 29,222 | 873,097 | 23,006,644 |
| Renter occupied Map | 24,289 | 1,079,166 | 40,730,218 |
| HOUSING UNITS, VACANT, VACANCY STATUS | |||
| For rent Map | 2,682 | 141,687 | 4,137,567 |
| Rented, not occupied Map | 178 | 6,684 | 206,825 |
| For sale only Map | 2,496 | 77,080 | 1,896,796 |
| Sold, not occupied Map | 619 | 17,978 | 421,032 |
| For seasonal, recreational, or occasional use Map | 15,321 | 263,071 | 4,649,298 |
| For migrant workers Map | 392 | 1,773 | 24,161 |
| Other vacant Map | 4,049 | 151,452 | 3,652,759 |
| HOUSING UNITS, OCCUPIED, AVERAGE HOUSEHOLD SIZE BY TENURE | |||
| Total: Map | 2.53 | 2.49 | 2.58 |
| Owner occupied Map | 2.56 | 2.57 | 2.65 |
| Renter occupied Map | 2.41 | 2.29 | 2.44 |
| HOUSING UNITS, OCCUPIED, TENURE BY RACE OF HOUSEHOLDER | |||
| Owner occupied: Map | 81,847 | 2,793,342 | 75,986,074 |
| Householder who is White alone Map | 75,540 | 2,452,233 | 63,446,275 |
| Householder who is Black or African American alone Map | 3,991 | 235,381 | 6,261,464 |
| Householder who is American Indian and Alaska Native alone Map | 577 | 13,611 | 509,588 |
| Householder who is Asian alone Map | 206 | 43,419 | 2,688,861 |
| Householder who is Native Hawaiian and Other Pacific Islander alone Map | 5 | 466 | 61,911 |
| Householder who is Some Other Race alone Map | 739 | 20,361 | 1,975,817 |
| Householder who is Two or More Races Map | 789 | 27,871 | 1,042,158 |
| Renter occupied: Map | 24,289 | 1,079,166 | 40,730,218 |
| Householder who is White alone Map | 18,145 | 706,229 | 26,308,077 |
| Householder who is Black or African American alone Map | 4,619 | 288,599 | 7,868,519 |
| Householder who is American Indian and Alaska Native alone Map | 267 | 9,065 | 430,119 |
| Householder who is Asian alone Map | 127 | 30,844 | 1,943,303 |
| Householder who is Native Hawaiian and Other Pacific Islander alone Map | 7 | 394 | 82,021 |
| Householder who is Some Other Race alone Map | 564 | 19,556 | 2,940,610 |
| Householder who is Two or More Races Map | 560 | 24,479 | 1,157,569 |
| HOUSING UNITS, OCCUPIED, TENURE BY HISPANIC OR LATINO ORIGIN OF HOUSEHOLDER | |||
| Owner occupied: Map | 81,847 | 2,793,342 | 75,986,074 |
| Not Hispanic or Latino householder Map | 79,660 | 2,728,916 | 69,617,625 |
| Hispanic or Latino householder Map | 2,187 | 64,426 | 6,368,449 |
| Renter occupied: Map | 24,289 | 1,079,166 | 40,730,218 |
| Not Hispanic or Latino householder Map | 22,833 | 1,028,909 | 33,637,301 |
| Hispanic or Latino householder Map | 1,456 | 50,257 | 7,092,917 |
| HOUSING UNITS, OCCUPIED, TENURE BY HOUSEHOLD SIZE | |||
| Owner occupied: Map | 81,847 | 2,793,342 | 75,986,074 |
| 1-person household Map | 18,267 | 643,556 | 16,453,569 |
| 2-person household Map | 32,203 | 1,031,004 | 27,618,605 |
| 3-person household Map | 12,427 | 446,449 | 12,517,563 |
| 4-person household Map | 10,613 | 392,843 | 10,998,793 |
| 5-person household Map | 5,047 | 177,918 | 5,057,765 |
| 6-person household Map | 2,012 | 64,470 | 1,965,796 |
| 7-or-more-person household Map | 1,278 | 37,102 | 1,373,983 |
| Renter occupied: Map | 24,289 | 1,079,166 | 40,730,218 |
| 1-person household Map | 9,192 | 436,122 | 14,751,340 |
| 2-person household Map | 5,823 | 276,445 | 10,624,023 |
| 3-person household Map | 3,788 | 157,033 | 6,240,422 |
| 4-person household Map | 2,874 | 111,472 | 4,626,453 |
| 5-person household Map | 1,516 | 56,156 | 2,480,866 |
| 6-person household Map | 690 | 24,502 | 1,108,903 |
| 7-or-more-person household Map | 406 | 17,436 | 898,211 |
Loading...